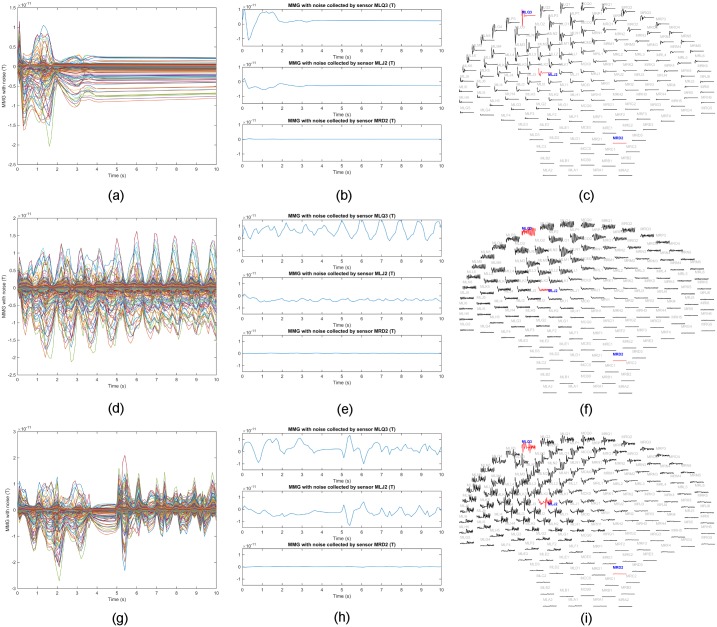
Fig 6. Sensor temporal courses of synthetic MMG data sets in Table 1.
(a) Synthetic MMG over all sensors with each curve representing the temporal course over one sensor for Data Set 1. (b) Example traces for Data Set 1 from sensors MLQ3, MLJ2, and MRD2, respectively. (c) Layout plot of Data Set 1 over SARA device. (d) Synthetic MMG over all sensors with each curve representing the temporal course over one sensor for Data Set 2. (e) Example traces for Data Set 2 from sensors MLQ3, MLJ2, and MRD2, respectively. (f) Layout plot of Data Set 2 over SARA device. (g) Synthetic MMG over all sensors with each curve representing the temporal course over one sensor for Data Set 3. (h) Example traces for Data Set 3 from sensors MLQ3, MLJ2, and MRD2, respectively. (i) Layout plot of Data Set 3 over SARA device.

