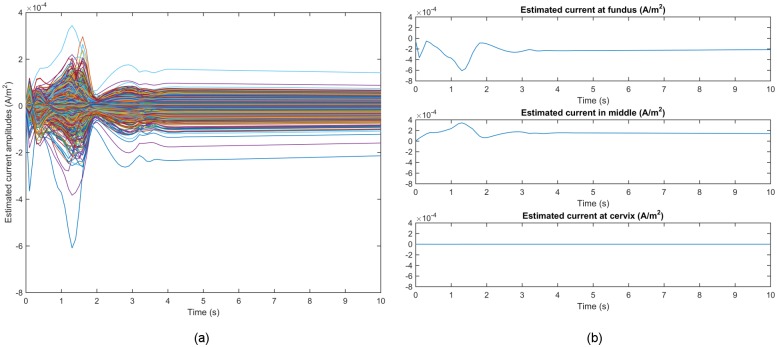
Fig 9. Temporal courses of estimated source current amplitudes for Data Set 1 in Table 1.
(a) Estimated source current amplitudes at all source locations with each curve representing the temporal course over one source location. (b) Example traces of estimated source current amplitudes at the fundus, middle, and cervix of the uterus, respectively.

