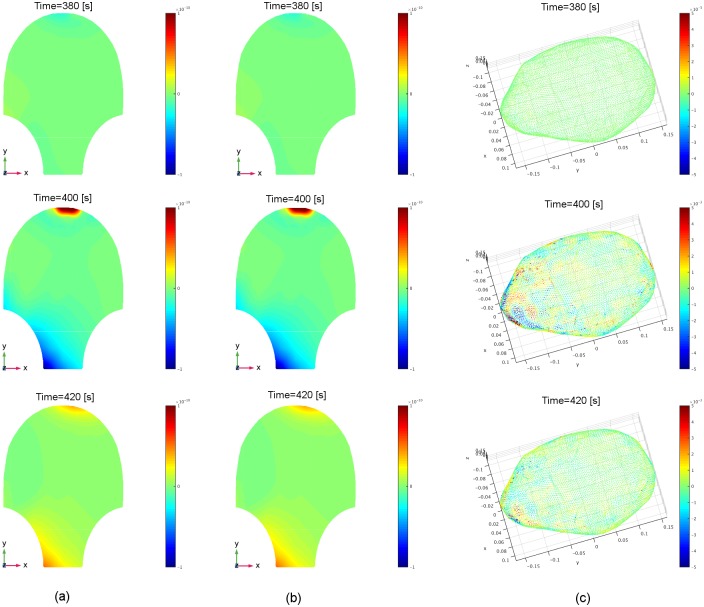
Fig 15. Estimated source current amplitudes and the corresponding estimated MMG of Data Set 1 in Table 2 at time instants t = 380 [s], 400 [s], 420 [s].
(a) Real MMG data on the abdominal surface collected by the SARA device (see the corresponding video in S2 Video). (b) Reconstructed MMG on the abdominal surface, using our estimated source currents. (c) Estimated source current amplitudes in the myometrium (see the corresponding video in S3 Video).

