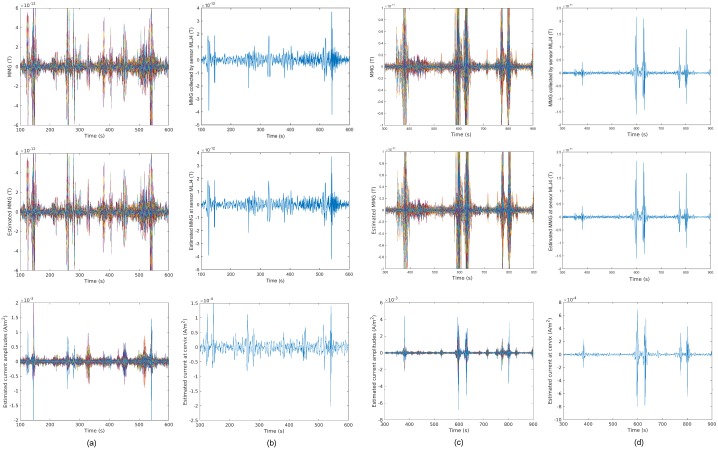
Fig 16. Sensor temporal courses of estimated source current amplitudes and the corresponding estimated MMG for Data Sets 2 and 3 in Table 2.
(a) Data Set 2, with MSE = 1.51 × 10⁻²⁴. (b) Example traces for Data Set 2. (c) Data Set 3, with MSE = 1.20 × 10⁻²³. (d) Example traces for Data Set 3.

