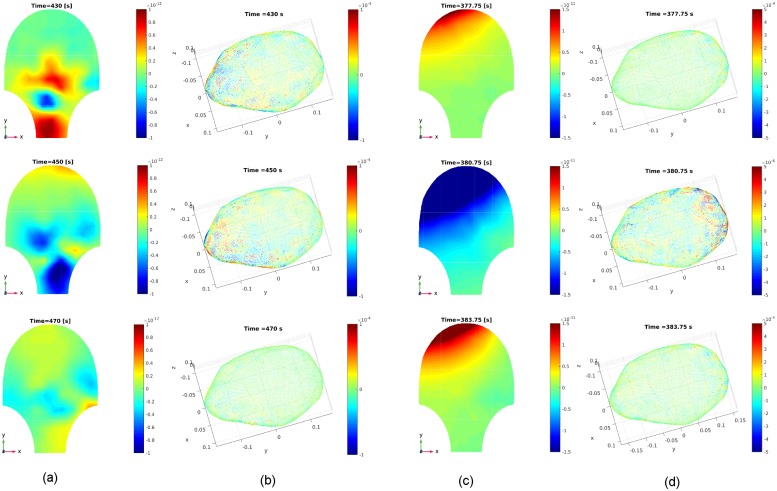
Fig 17. Estimated source current amplitudes for Data Sets 2 and 3 in Table 2 at different time instants.
(a) Real MMG data for Data Set 2 at time instants t = 430 [s], 450 [s], 470 [s]. (b) Estimated source current amplitudes in the myometrium for Data Set 2. (c) Real MMG data for Data Set 3 at time instants t = 377.75 [s], 380.75 [s], 383.75 [s]. (d) Estimated source current amplitudes in the myometrium for Data Set 3.

