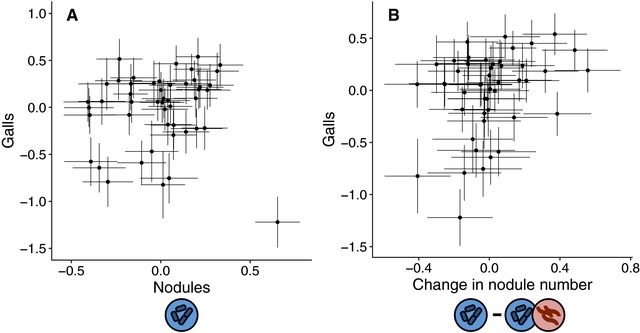
Figure 3.

Genetic correlation between the number of galls and nodules that plants produce. Points are conditional modes (BLUPs) for each plant genotype ± SE. (A) Genetic correlation between gall number and the number of nodules produced by plants in the absence of nematodes. There is a significant positive correlation when the outlier in the lower right‐hand corner is excluded (r = 0.30, P = 0.039), but not when it is included (r = 0.06, P = 0.710). (B) Genetic correlation between gall number and the change in nodule number in the absence and presence of nematodes (r = 0.31, P = 0.034). Excluding HM170 did not qualitatively change this result (r = 0.29, P = 0.052). We used a resampling approach to generate the standard errors on the change in nodule number in panel B.
