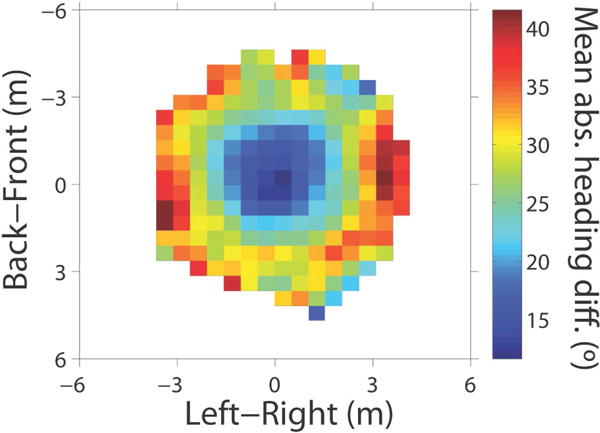
Figure 4.

Data from the human ‘swarm’: Heat map of mean absolute heading difference (deg) between the central participant nearest the center of the swarm (at [0,0], heading upward) and each neighbor, averaged over 6 min of data (three 2-min trials, initial interpersonal distance of 2m) (cell=0.5×0.5m). Reprinted from Rio, et al. (2017)
