
Figure 5.
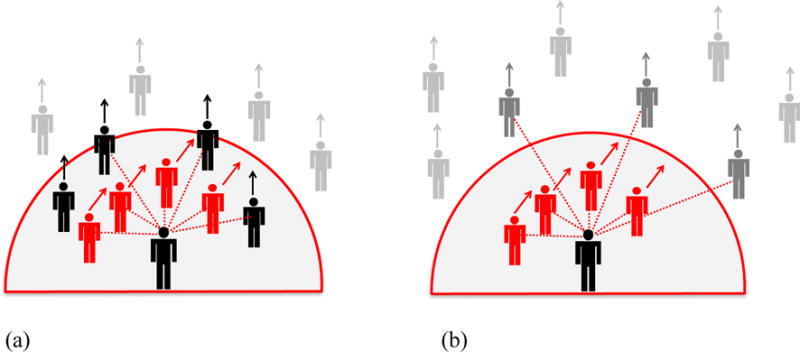
Metric and topological neighborhoods. On the metric hypothesis, the participant is influenced by all neighbors within a fixed radius (shaded region); on the topological hypothesis, the participant is influenced by a fixed number of nearest neighbors (dotted red lines). (a) High density condition: Both metric and topological neighborhoods contain perturbed (red) and unperturbed (black) neighbors. (b) Low density condition: The metric neighborhood contains fewer unperturbed neighbors (gray) than before, so the metric hypothesis predicts a greater response to the perturbed neighbors (red). But the nearest neighbors remain the same, so the topological hypothesis predicts the same response to the perturbed neighbors.