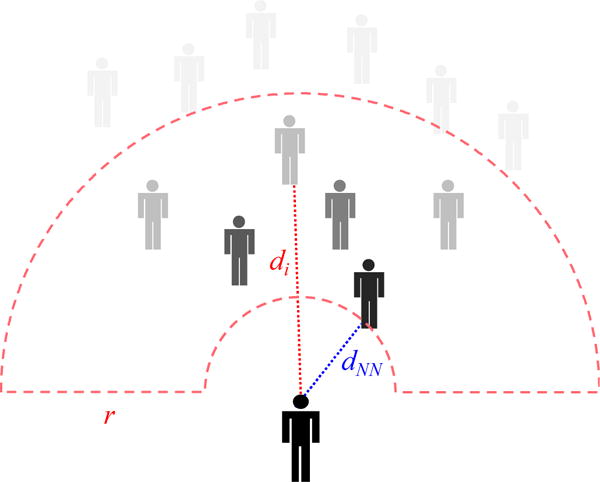
Figure 6.

Neighborhood model. The participant’s response is a weighted average of neighbors i, where the weight decays gradually with distance to the nearest neighbor (dNN) up to 11m, and more rapidly within the crowd (di-dNN), creating a flexible neighborhood with a soft radius (r=4m).
