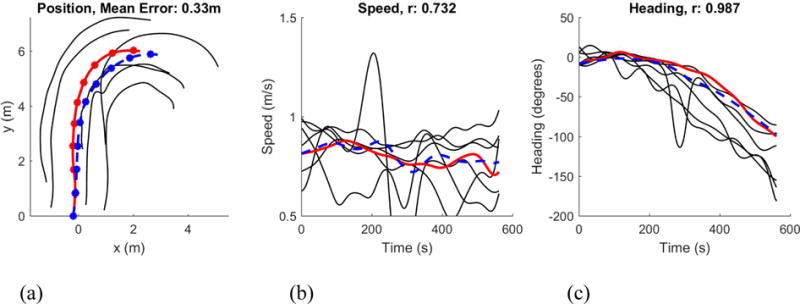
Figure 7.

Simulation of a sample trajectory from the human ‘swarm’. (a) Path in space (dots at 1s intervals). (b) Time series of speed. (c) Time series of heading. Solid red curve corresponds to participant, dashed blue curve to model agent, black curves to neighbors in the neighborhood that were input to model. Simulations were performed on ten 10s segments of swarm data that had continuous tracking of ≥8 neighbors.
