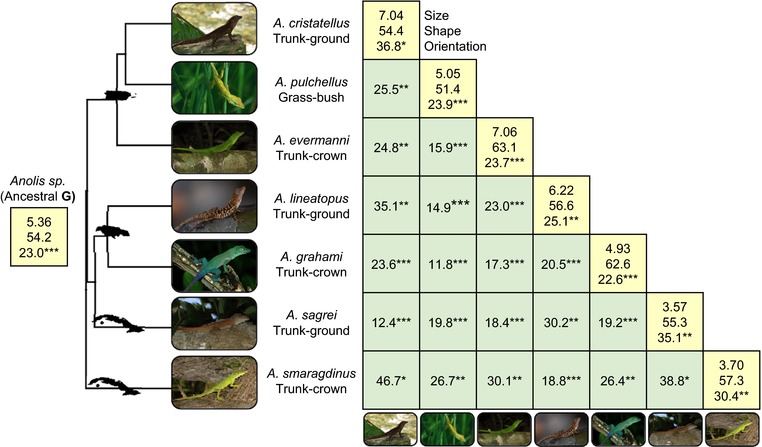
Figure 1.

Divergence of genetic architecture across the Anolis radiation. Numbers on the diagonal represent size (total genetic variance × 103), shape (percent variance explained by gmax), and orientation (vector angle between gmax and the major axis of divergence, d1). Numbers off the diagonal represent the angle in degrees between gmax vectors for a species pair. All estimates of gmax were significantly more aligned than expected by chance (see Methods; * P < 0.05, ** P < 0.01, *** P < 0.001). All estimates of gmax were also aligned with both d1 and h1, the axis of greatest shared genetic variance (Table S4). Statistics for a reconstruction of the ancestral G using maximum likelihood are presented at the root of the phylogeny (Zheng and Wiens 2016), which has an estimated date of 41.5–43.5 million years ago (Zheng and Wiens 2016; Poe et al. 2017). The most recent splits in the phylogeny occurred approximately 19.8–22.5 million years ago (Zheng and Wiens 2016; Poe et al. 2017). The island of origin for each group is indicated on the phylogeny (from top to bottom, Puerto Rico, Jamaica, and Cuba).
