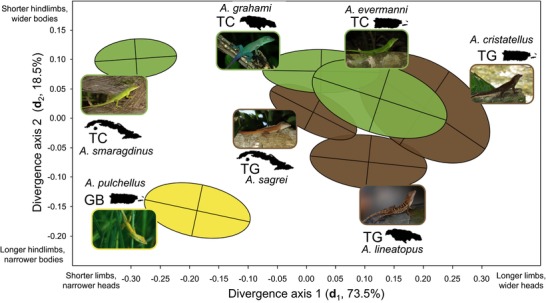
Figure 2.

Relationship between species divergence and genetic architecture. Species‐specific G matrices were visualized by transforming estimated breeding values for each trait using the divergence eigenvectors d1 and d2 and plotting 95% confidence ellipses centered at the multivariate species mean. Ellipses are color‐coded by ecomorph, with trunk‐crown (TC) species in green, trunk‐ground (TG) species in brown, and the grass‐bush (GB) species in yellow. The major axis of morphological divergence (d1) is aligned with the major axis of genetic variance shared by all G matrices (h1; Table 4). The axis of greatest divergence in G (e11) is aligned with d1 and primarily represents changes in G‐matrix size (total genetic variance; Figs. 1, 3, Table 4). See Fig. 1 for island names.
