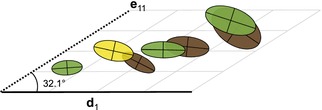
Figure 3.

Representations of G matrices as ellipses (as in Fig. 2), plotted by species coordinates within the axes of greatest divergence of species means (d1) and the subspace with the greatest divergence of G matrices (E1, represented by its first eigenvector e11). Ellipses to the right are larger, illustrating the correlation between matrix size (total genetic variance) and species coordinates within E1.
