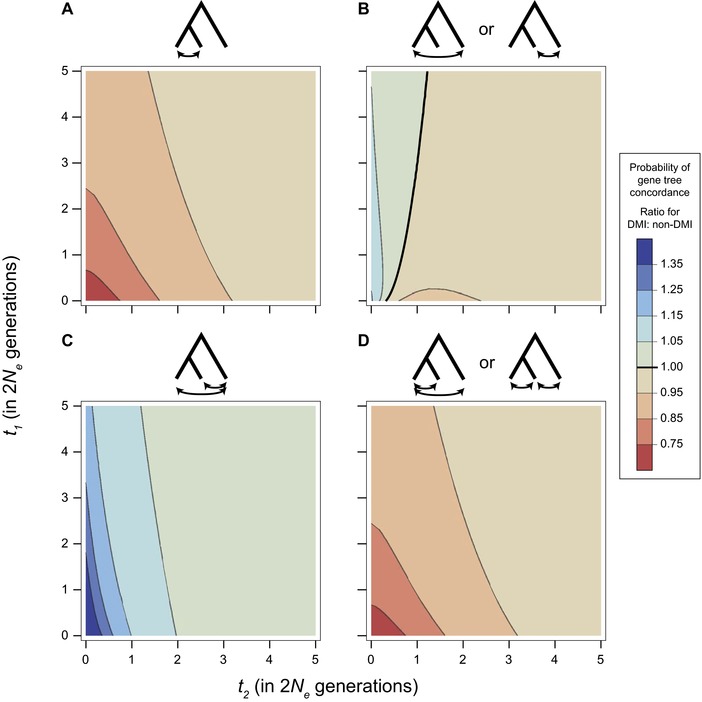
Figure 5.

Relative probability of concordance conditioned on the pattern of reproductive isolation. Contour plots show a ratio of the probability of gene–tree species–tree concordance for a DMI locus relative to a random non‐DMI locus. Bold line in (B) and in the legend indicates where the probability of concordance is equal between the two types of loci. All other panels show results that are always either above or below a ratio of 1.
