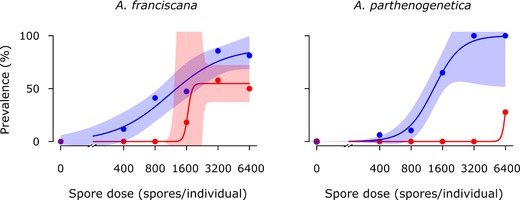
Figure 1.

Infectivity of A. rigaudi (blue) and E. artemiae (red) in A. franciscana (left) and A. parthenogenetica (right). Points indicate the prevalence (% infected) at each dose; lines are the best fits and the shaded areas represent the 95% CIs. Because the inflection point of E. artemiae in A. franciscana was poorly resolved, uncertainty was high here. It was not possible to calculate a confidence interval for E. artemiae in A. parthenogenetica due to low resolution.
