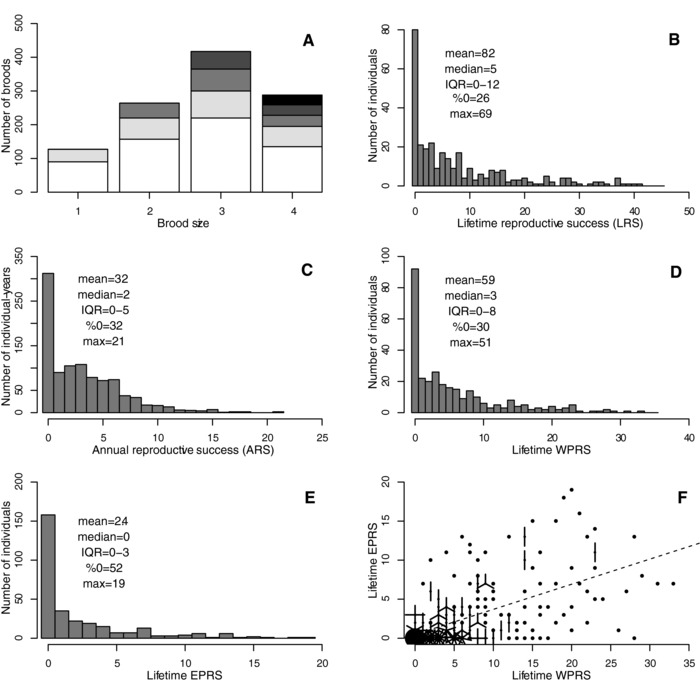
Figure 1.

Phenotypic distributions of (A) female extra‐pair reproduction with respect to brood size, and adult male (B) lifetime reproductive success, (C) annual reproductive success, (D) lifetime within‐pair reproductive success (LWPRS) and (E) lifetime extra‐pair reproductive success (LEPRS), and (F) the phenotypic relationship between LWPRS and LEPRS across individual males. On A, white, light gray, mid gray, dark gray, and black respectively denote zero, one, two, three, and four extra‐pair offspring within a brood of each size. On F, points denote single datapoints, line segments denote further identical datapoints and the dashed line shows the linear regression of LEPRS on LWPRS (phenotypic correlation coefficient: 0.63). On B–E, the mean, median, interquartile range (IQR), percentage of observations that were zero (%0) and maximum (max) are shown. To facilitate visualization, one male with very high (i.e., max) reproductive success is not plotted on B, D, or F.
