
Figure 1.
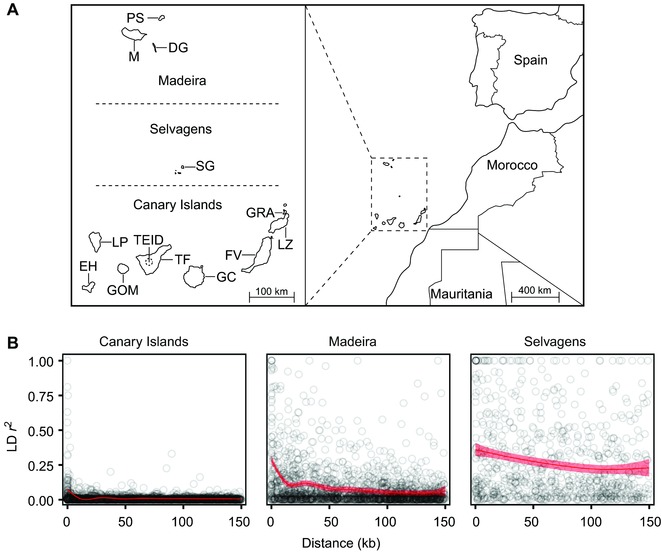
Sampling locations, genetic diversity, and linkage disequilibrium in Berthelot's and tawny pipits. (A) Map of Berthelot's pipit and tawny pipit sampling locations. (B) The relationship between linkage disequilibrium and base‐pair distance for SNPs in the Canary Islands, Madeira, and Selvagens archipelagos. The red line shows a general additive model, with the shaded band indicating 95% confidence intervals.