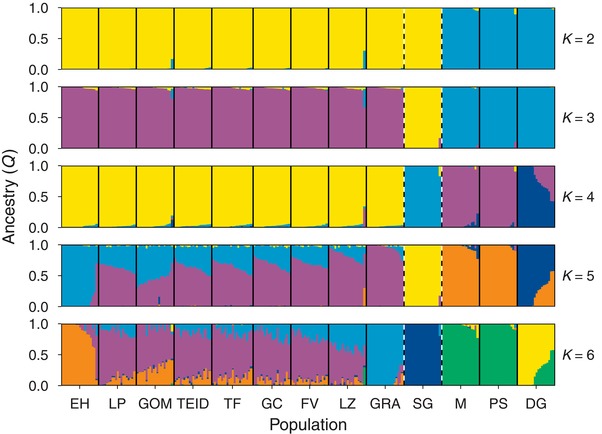
Figure 2.

Admixture analysis at K = 2 to K = 6 clusters for Berthelot’s pipit. Vertical bars represent individual pipits, and are colored by their assignment to each one of K clusters. Solid black lines indicate separate populations; dashed black lines indicate separate archipelagos. Populations from left to right: Canary Islands – El Hierro (EH), La Palma (LP), Gomera (GOM), Teide (TEID), Tenerife (TF), Gran Canaria (GC), Fuerteventura (FV), Lanzarote (LZ), Graciosa (GRA); Selvagens – Selvagem Grande (SG); Madeira – Madeira (M), Porto Santo (PS), Deserta Grande (DG).
