
Figure 1.
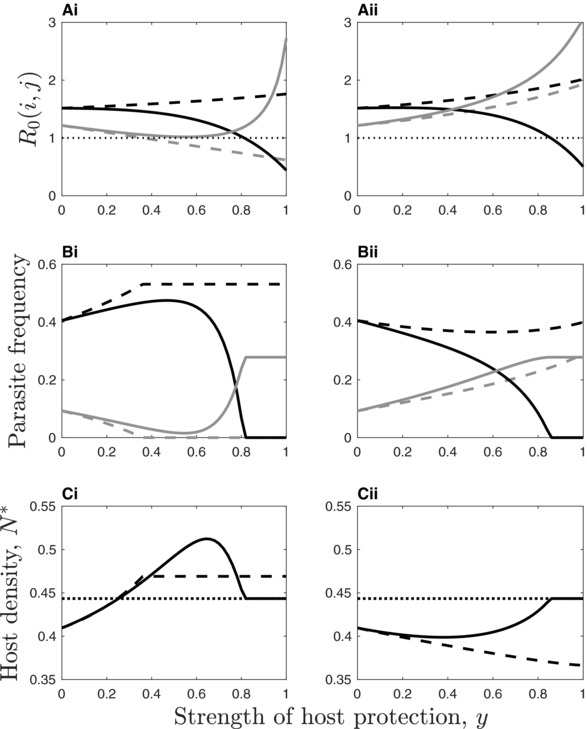
Impact of parasite‐conferred resistance (left) and tolerance (right) on the ecological dynamics. Dashed lines correspond to (no costs) and solid lines to accelerating transmission rate costs . (Ai–ii) The basic reproductive ratio, , of parasite (black and gray, respectively) when parasite is at equilibrium (the dotted line shows the exclusion threshold). (Bi–ii) Parasite frequency at equilibrium. (Ci–ii) Host density at equilibrium (the protective parasite is a net mutualist when host density is above the dotted line). Parameters: , , , , , , , , .