
Figure 2.
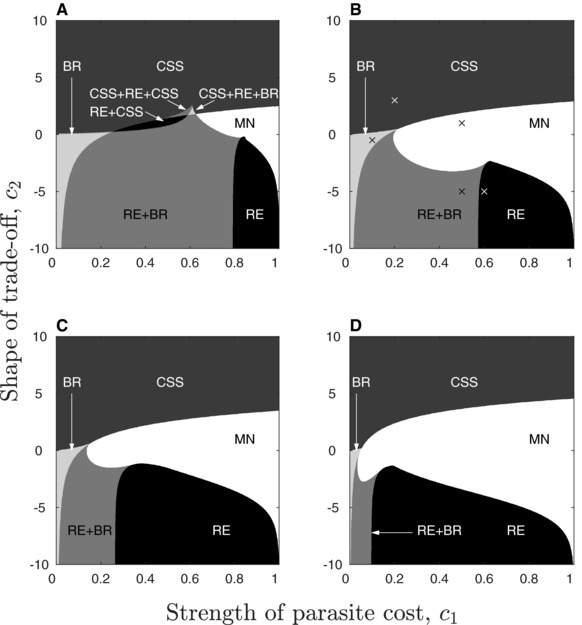
Evolution of parasite‐conferred resistance when there is a transmission rate cost. Higher values of c 1 correspond to greater costs, and higher (lower) values of c 2 correspond to more strongly accelerating (decelerating) costs (eq. (1)). Qualitative outcomes: minimisation (MN); intermediate continuously stable strategy (CSS); repeller (RE); and evolutionary branching (BR). The natural mortality rate, b, increases from 0.05 (left column) to 0.5 (right column). The virulence of parasite 1, , increases from 0.1 (top row) to 1 (bottom row). Crosses in panel B correspond to Fig. 3. Remaining parameters as described in Fig. 1.