
Figure 3.
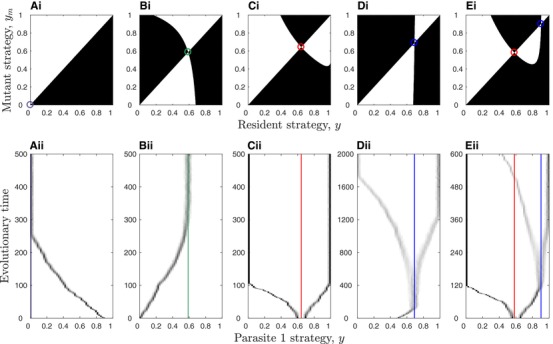
Pairwise invasion plots (PIPs; top) and simulations (bottom) for the points in Fig. 2B: (A) minimisation (purple); (B) CSS (green); (C) repeller (red); (D) evolutionary branching (blue); (E) repeller (red) and evolutionary branching (blue). The mutant can only invade in the black regions of the PIPs, which means that y increases (decreases) when the region immediately above (below) the line is black and the region immediately below (above) this line is white. Note that plots C and E show two separate simulations with different initial conditions either side of the repeller. Same parameters as Fig. 1, with .