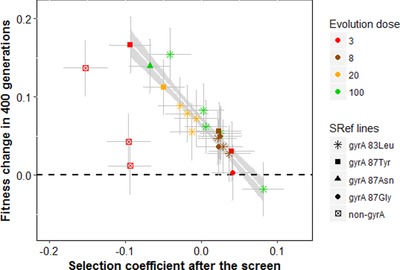
Figure 3.

Fitness change per resistant line after 400 generations of evolution versus initial fitness in the measure dose corresponding to the evolution dose (lines evolved at dose 200 were measured in dose 150, so were not included here). Symbols indicate the gyrA mutations sequenced in each line while colors indicate the dose at which they were selected and evolved. The best model yields different intercepts for non‐gyrA lines (open squares) and gyrA lines (all other symbols, the corresponding model indicated by the gray zone). Selection coefficients after the screen (x‐axis) correspond to the fitness differences with the RRef strain used as the competitor in each case. Fitness change (y‐axis) refers to the difference of selection coefficients against the RRef strain after evolution and after the screen for the same line. Dots and error bars are mean values across replicates and the corrected standard errors associated with these values.
