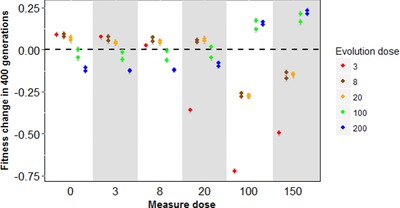
Figure 4. Fitness change of the RRef‐lines compared with their ancestor (the RRef strain).

Fitness change of the RRef‐lines compared with their ancestor (the RRef strain). The RRef lines evolved during 400 generations in different Nal antibiotic in μg/mL doses (colors) at different measure doses (x‐axis). Each dot represents the mean value for a line across replicates associated with its standard error. Positive values indicate an adaptation to the measure dose whereas negative values stand for a counter‐adaptation.
