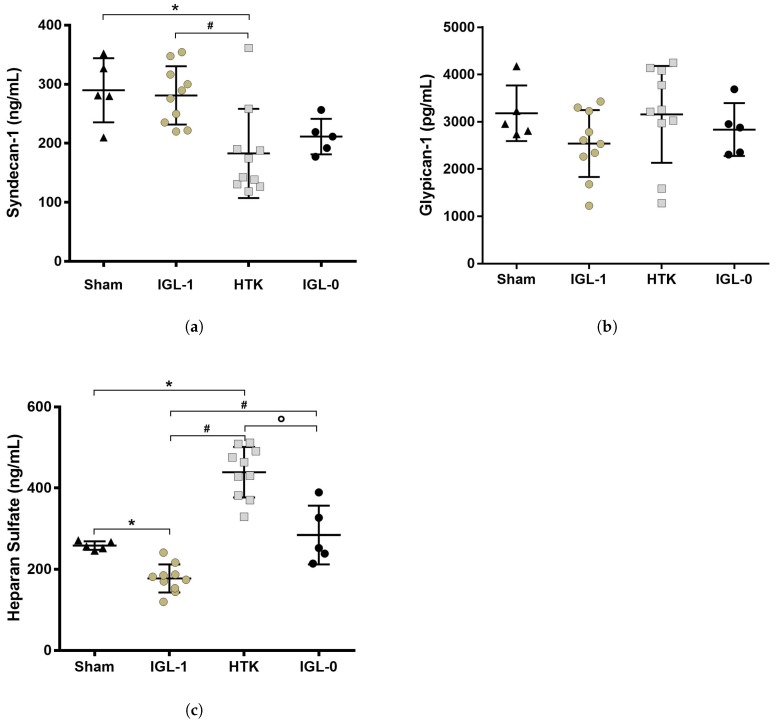
Figure 3.
Glycocalyx protection in fatty livers after 24 h of cold storage. Protein expression of the three main components of the glycocalyx were measured by ELISA from tissue samples. (a) Syndecan-1 level was lower in HTK group compared to Sham and IGL-1 groups; (b) glypican-1 expression was the same in all the groups; (c) Heparan sulfate expression was lower in IGL-1 group compared to the three other groups and the opposite for HTK which expressed a higher level of HS. Results are presented as mean (SD), IGL-1/HTK n = 10/group, Sham/IGL-0 n = 5/group, * p < 0.05 vs. Sham; # p < 0.05 vs. IGL-1; ° p < 0.05 vs. HTK (One-way ANOVA).

