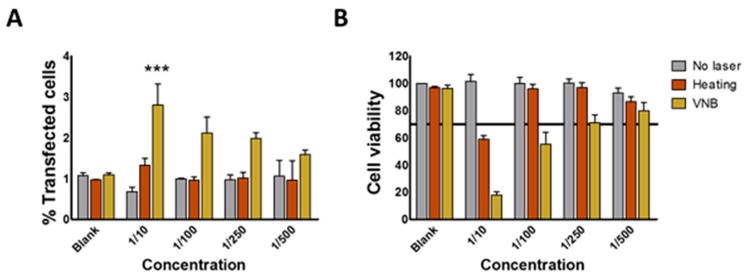
Figure 7.
Evaluating transfection efficiency and cell viability in HeLa cells after laser irradiation in the heating or VNB regime. (A) the graph shows the percentage of cells that are positive for GFP transfection for different dilutions of JetPEI/pDNA/AuNP 5 pt complexes 24 h after laser irradiation; (B) the graph shows the corresponding percentage of viable cells as measured by DAPI staining. All graphs show mean ± SEM; n = 3. Significance was calculated using two-way ANOVA with a Bonferroni post-test (compare means to blank) (*** p < 0.001).

