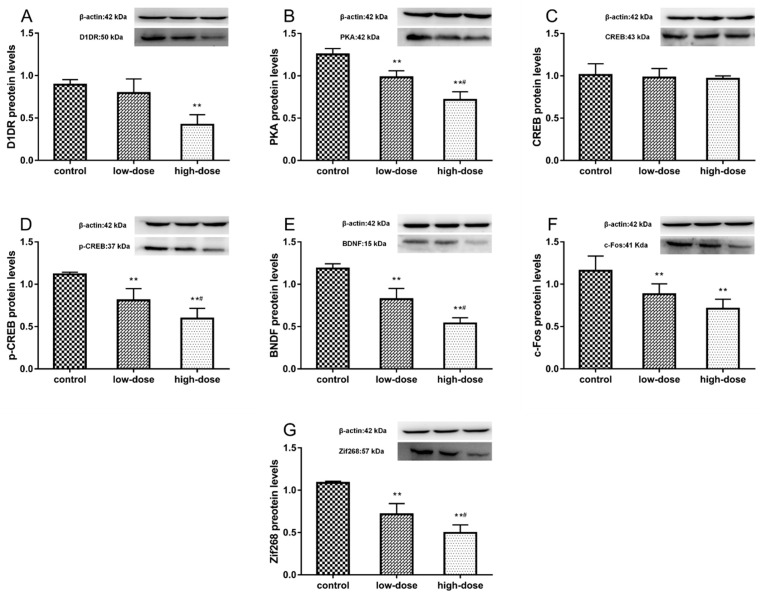
Figure 6.
Effects of atrazine (ATR) exposure on protein expression levels in the hippocampus were measured using western blot analysis. (A) D1DR, (B) PKA, (C) CREB, (D) p-CREB, (E) BDNF, (F) c-Fos, and (G) Zif268. Expression levels were standardized to β-actin. Each column represents the mean ± S.E.M, six rats per group, ** p < 0.01 vs. the control group. # p < 0.01 between ATR-treated groups.

