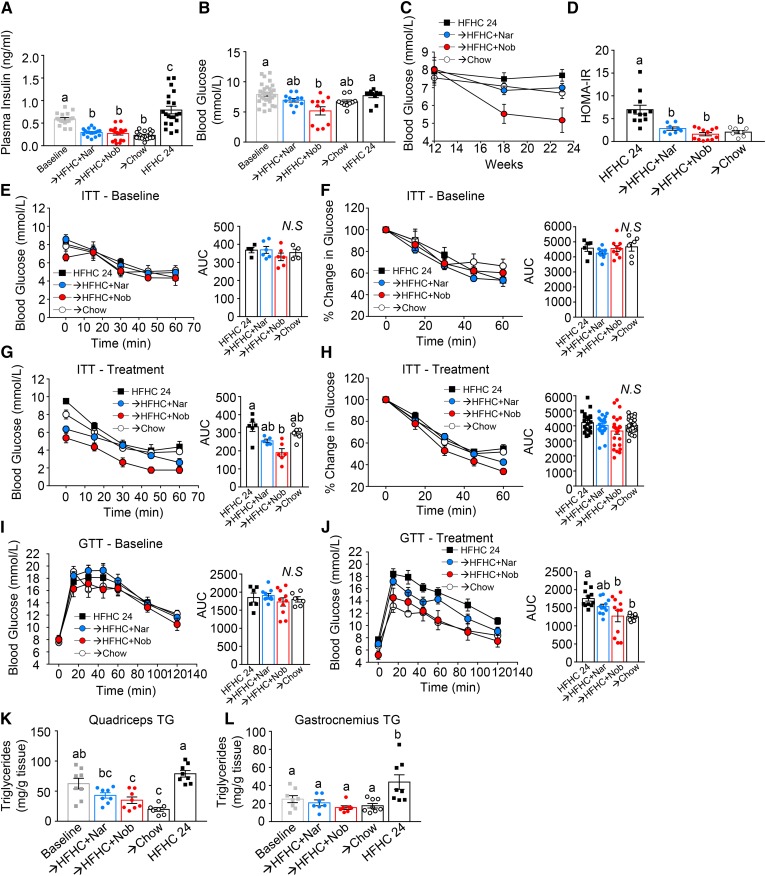
Fig. 3.
Intervention with citrus flavonoids restores glucose homeostasis. Ldlr−/− mice were fed a HFHC diet for 12 weeks. Subsequently the same mice were treated with flavonoids added to the HFHC diet for an additional 12 weeks. A: Fasting (6 h) plasma insulin levels (n = 17–20 per group). B: Fasting (6 h) blood glucose (n = 10–32 per group). C: Fasting (6 h) blood glucose in the same mice at baseline and 6 weeks and 12 weeks of intervention (n = 11 per group). D: HOMA-IR (n = 7–12 per group). E, F: Insulin tolerance test (ITT) at baseline shown as blood glucose concentrations (n = 4–6 per group) (E) and percent change in glucose from time = 0 (n = 6–9 per group) (F). G, H; ITT at 12 weeks intervention shown as blood glucose concentrations (n = 5–6 per group) (G) and percent change in glucose from time = 0 (n = 22–24 per group) (H). I: Glucose tolerance test (GTT) at baseline (n = 6–9 per group). J: GTT at 12 weeks intervention (n = 10–11 per group). K, L: Muscle TG content in quadriceps (n = 8 per group) (K) and gastrocnemii and solei (n = 7–8 per group) (L). Data represent the mean ± SEM. Different letters are statistically different by ANOVA with post hoc Tukey test (P < 0.05). Nar, naringenin; Nob, nobiletin; N.S., not significant.

