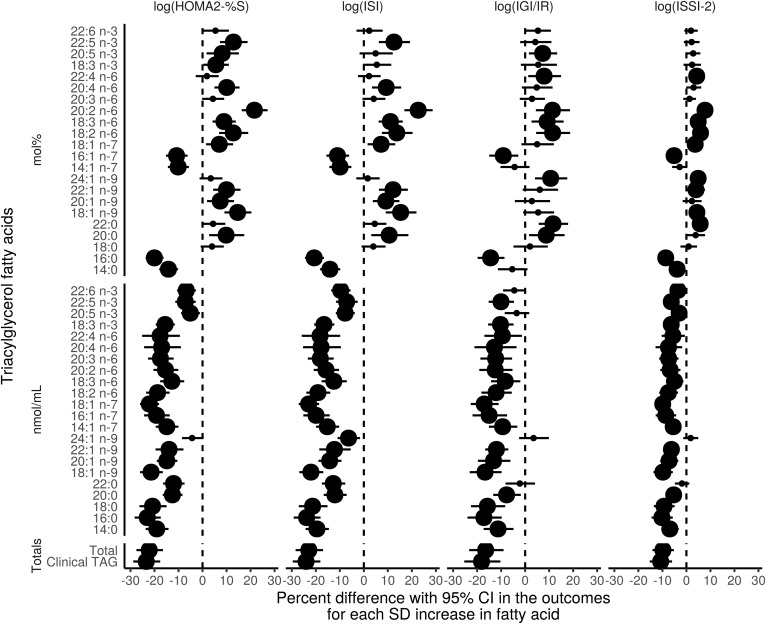
Fig. 5.
Time-adjusted GEE models of the association of the TGFAs (mol% and nmol/ml) and total clinically measured TG with IS and β-cell function outcomes using the 6 year longitudinal data from the PROMISE cohort. The x-axis values represent a percent difference in the outcome per SD increase in the FA. P values were adjusted for the BH false discovery rate, with the largest dot representing a significant (P < 0.05) association.

