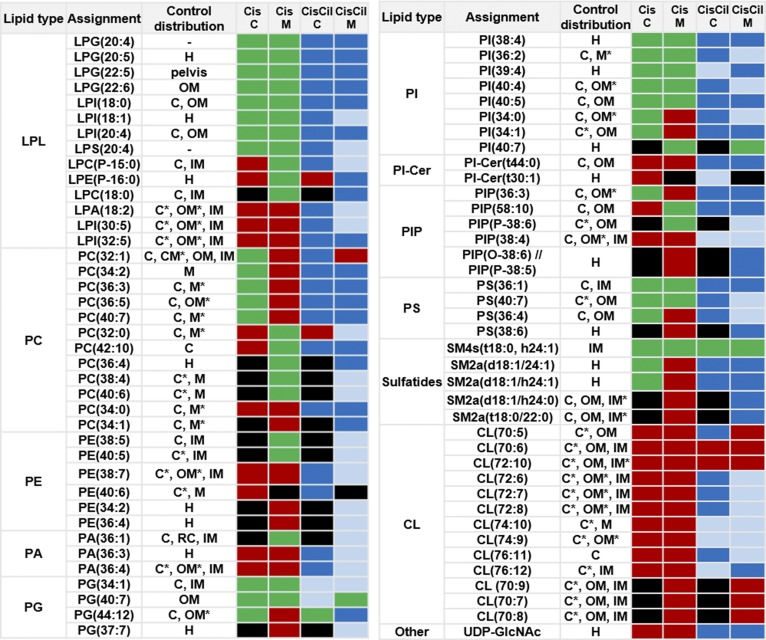
Fig. 2.
Protective effect of cilastatin against cisplatin-induced alterations on cortical and medullary renal lipids. MALDI-MSI relative quantification results are shown for 77 species (76 lipids), according to their lipid class, for control rat kidney versus cisplatin (Cis) or cisplatin+ cilastatin (CisCil)-treated kidney in cortex (C) and medulla (M). The effect of cisplatin and cilastatin with respect to control lipid levels (with FDR < 0.05) is presented with the following color code: red, decrease versus control; green, increase versus control; black, no change versus control; blue, total recovery versus control levels; light blue, partial recovery versus control levels. Control kidneys lipid location is presented with the following abbreviations: C, cortex; CM, corticomedullary junction; H, homogeneous distribution; IM, inner medulla; M, medulla (including OM and IM); OM, outer medulla; RC, renal column. * denotes kidney region with the highest lipid intensity, when present in several regions.

