Fig. 3.
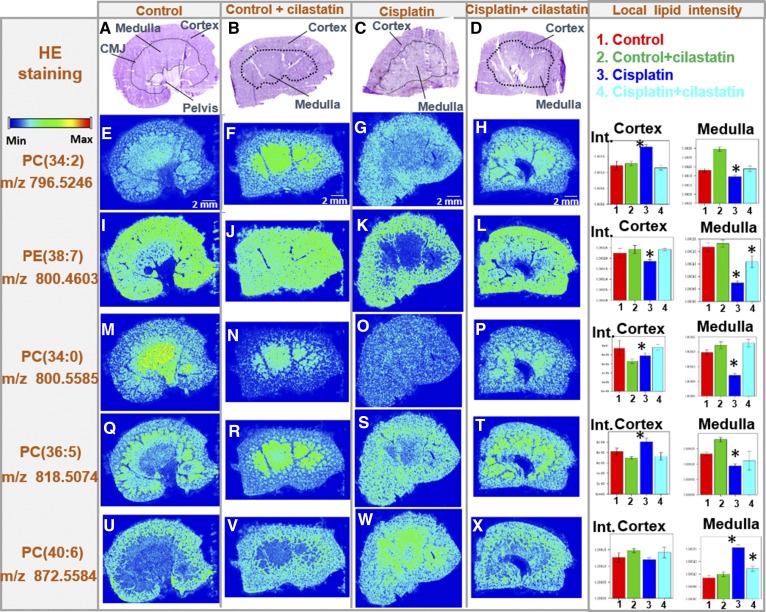
Cilastatin protects against cisplatin-induced lipid alterations: structural lipids (PC and PE) found in positive ion mode. HE-stained kidney sections images are displayed (A–D for control, control+cilastatin, cisplatin, and cisplatin+cilastatin, respectively) along with the delimited cortex, medulla, and corticomedullary junction (CMJ) regions. Their respective MALDI-MSI images in positive-ion mode for selected lipid distributions have been included below each HE image: PC(34:2) (E–H), PE(38:7) (I–L), PC(34:0) (M–P), PC(36:5) (Q–T), and PC(40:6) (U–X). Color-scale bar is shown for lipid images. Right: Bar charts for the local lipid intensities observed for the four groups in either kidney cortex or medulla are displayed next to the lipid distribution images for each of the lipid species selected. Control (1), control+cilastatin (2), cisplatin (3), and cisplatin+cilastatin (4) groups are represented in red, green, blue, and cyan, respectively. * FDR < 0.05 versus all other groups; # FDR < 0.05 versus control group.

