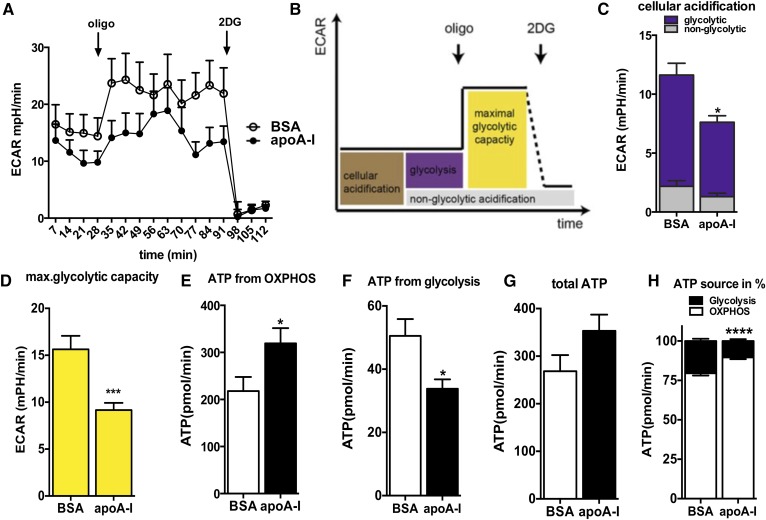
Fig. 4.
apoA-I reduces glycolytic activity in primary astrocytes and enhances ATP demand fueled by OXPHOS. A: The ECAR was recorded simultaneously with the OCR of astrocytes incubated with BSA or apoA-I (20 μg/ml overnight) with a Seahorse XF96 extracellular flux analyzer, as described in the Materials and Methods. B: Scheme defining cellular ECAR processes. Data after FCCP and rotenone/antimycin A injection were not used for ECAR analysis. C: By inhibiting glycolysis with 2DG (100 mM) as the last step in the measurements, cellular acidification was broken down to nonglycolytic acidification (gray) and acidification due to glycolysis (purple). D: By inhibiting mitochondrial ATP synthesis with oligomycin, the maximal glycolytic capacity was obtained. E: ATP production rates of OXPHOS pathways of BSA-treated (open bar) and apoA-I-treated (closed bar) primary astrocytes. F: ATP production rates of glycolysis as estimated via PPRs of BSA-treated (open bar) and apoA-I-treated (closed bar) primary astrocytes. G: Sum of ATP produced by OXPHOS and glycolysis of BSA-treated (open bar) and apoA-I-treated (closed bar) primary astrocytes. H: Percentage of OXPHOS (closed bars) and glycolytic (open bars) ATP production on total ATP production in BSA- and apoA-I-treated primary astrocytes. Data are expressed as the mean ± SEM of five replicates run in parallel. *P < 0.05, ***P < 0.0005, ****P < 0.00005.

