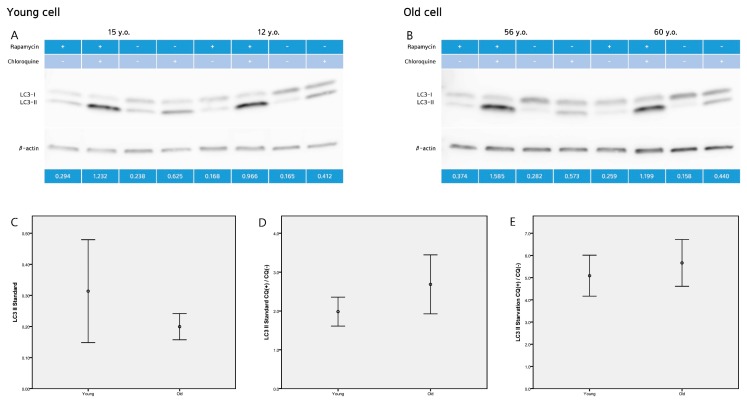
Figure 4.
Western blot analysis (A,B) revealed that the level of LC3-II protein, were (C) 0.31 ± 0.23 (young fibroblasts) and 0.20 ± 0.76 (old fibroblasts) (p = 0.087) at standard (basal) conditions. (D) The ratio of LC3-II with and without chloroquine were 1.98 ± 0.52 (young fibroblasts) and 2.68 ± 1.37 (old fibroblasts) (p = 0.138) at standard conditions. (E) Under starvation conditions (induced by rapamycin), the ratio of LC3-II with and without chloroquine increased to 5.09 ± 0.52 (young fibroblasts) and 5.66 ± 1.90 (old fibroblasts) (p = 0.413). Images are representative of two separate experiments on n = 32 samples (15 young and 17 old). LC3-II expression is normalized to actin (arbitrary units). Data are provided as mean ± SD. p values < 0.05 were considered statistically significant.

