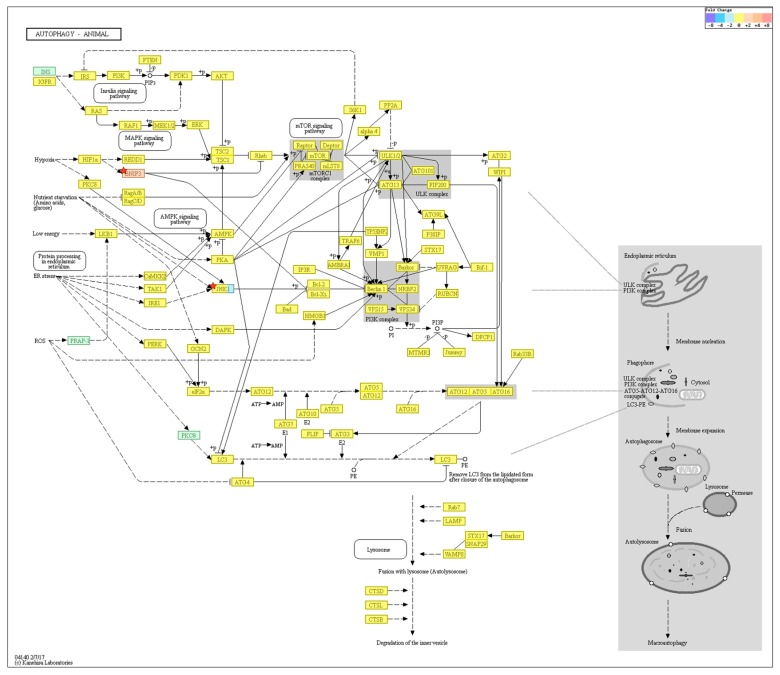
Figure 6.
KEGG pathway analysis on autophagy. Among the genes, BNIP3 was upregulated and MAPK10 downregulated in the old cells but were not statistically significant. n = 4 in each group. Only those genes exhibiting log2 fold change (FC) > 2 and p < 0.05 were considered to be differentially expressed genes.

