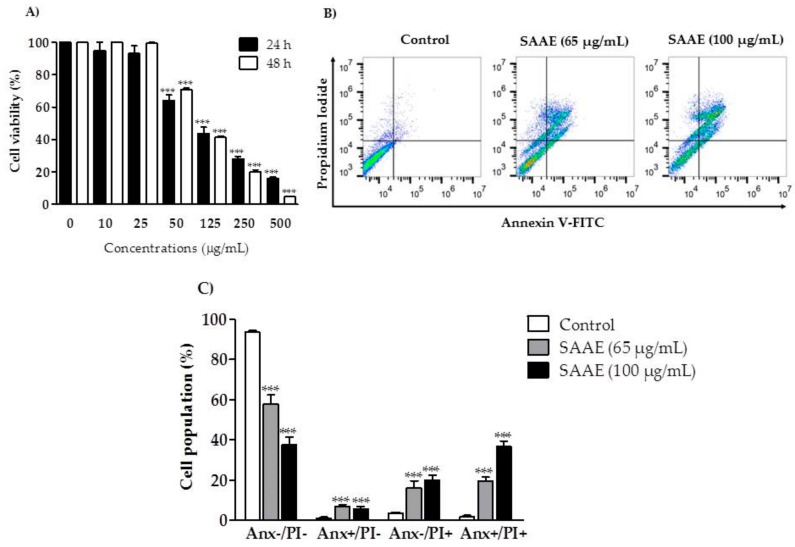
Figure 7.
Viability and cell death profiles of the B16F10Nex-2 melanoma cell line after treatment with different concentrations of the SAAE. (A) Cell viability versus concentration (10–500 µg/mL) after 24 and 48 h of treatment. (B) Diagram of flow cytometry of cells stained with Annexin V–fluorescein isothiocyanate (FITC) and propidium iodide (PI) after a 24 h of treatment with the SAAE (65 and 100 µg/mL). The lower left quadrant (Anx−/PI−) represents viable cells, the lower right quadrant (Anx+/PI−) represents apoptotic cells, the upper left quadrant (Anx−/PI+) represents necrotic cells, and the upper right quadrant (Anx+/PI+) represents late apoptotic cells. (C) Percentage of dead cells assessed in the diagram corresponding to concentrations of 65 and 100 µg/mL. Data are expressed as the mean ± SEM (n = 3) in duplicates. *** p < 0.0001, compared with the untreated control group.

