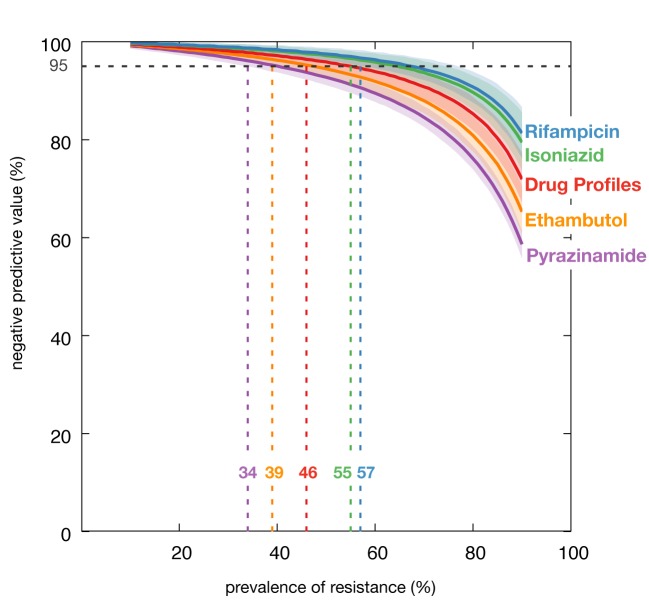
Figure 1. Simulated negative predictive values for individual drugs and complete drug profiles.
Negative predictive vales shown for individual drugs and complete drug profiles, according to simulated prevalence of resistance to each drug, or within each drug profile (‘any resistance’). For each percentage prevalence between 10% and 90%, 1,000 isolates were randomly selected, 1,000 times. Lines indicate the median with shaded areas showing the 95% confidence intervals.

