FIG 2.

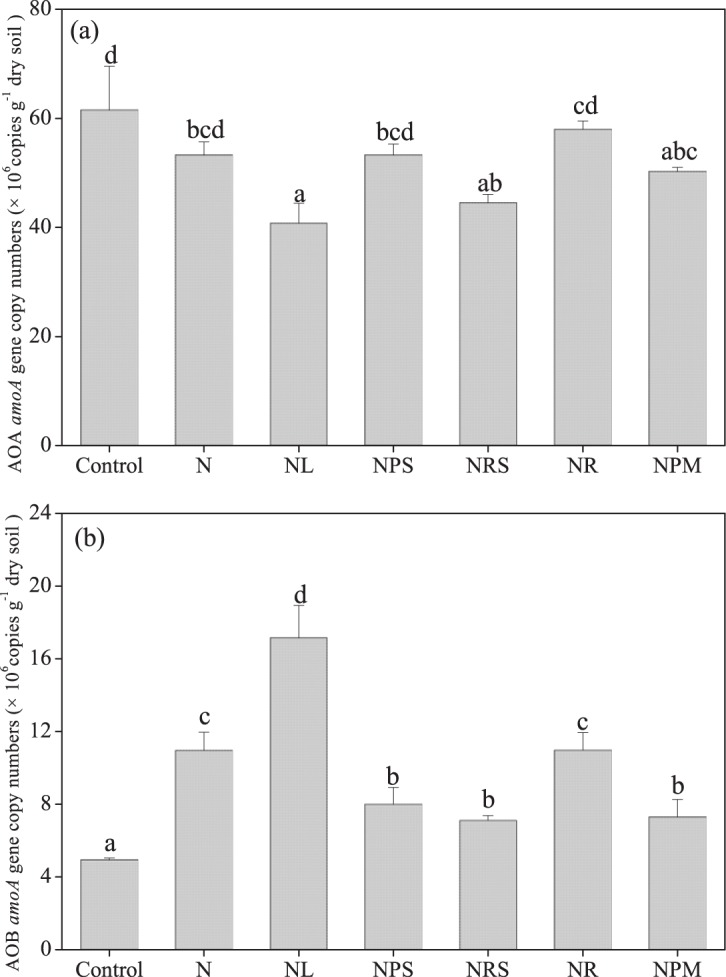
Abundances of amoA genes of ammonia-oxidizing archaea (AOA) (a) and ammonia-oxidizing bacteria (AOB) (b) in the treatments. Vertical bars represent SEMs (n = 3). Different letters denote significant differences between treatments (P < 0.05).

Abundances of amoA genes of ammonia-oxidizing archaea (AOA) (a) and ammonia-oxidizing bacteria (AOB) (b) in the treatments. Vertical bars represent SEMs (n = 3). Different letters denote significant differences between treatments (P < 0.05).