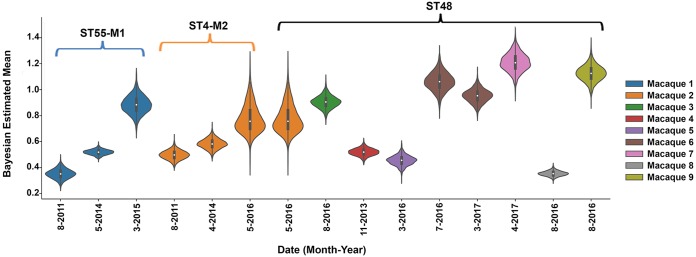
FIG 2.
Posterior credible intervals of biofilm production from 15 E. faecalis strains. Biofilm was measured using a crystal violet assay (47). Each macaque is represented in a different color, and the STs are indicated. Experiments were performed a minimum of three times on different days using 6 to 12 replicates per strain. Violin plots show the Bayesian estimated posterior of the mean OD570 readings; the interquartile range is indicated by the thicker black bars inside each violin, and the median is indicated by the white circle. For strains with completely overlapping violin plots, there is no way to distinguish between biofilm-forming ability, while strains with completely disparate violin plots can be interpreted to have differences in biofilm-forming ability. M1 and M2, macaques 1 and 2, respectively.

