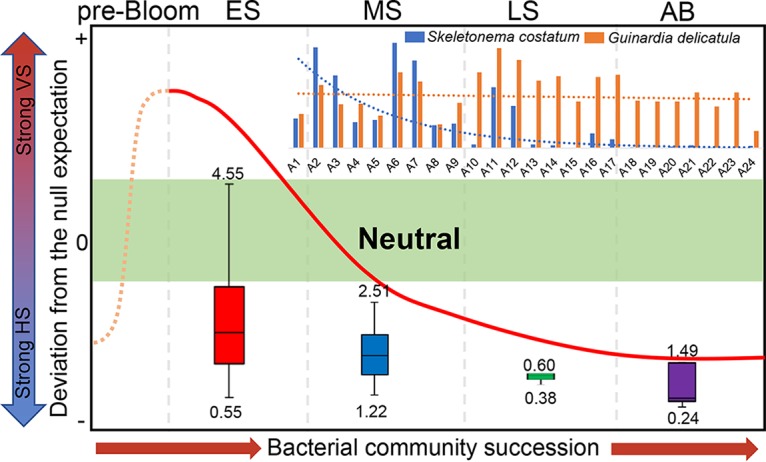
FIG 6.

Simulation model of the successional pattern of microbial communities based on βNTI distributions. Ecological selection is weak from −2 to 2 (green area), while selection is strong toward positive and negative values on the y axis, resulting from strong variable selection (VS) and homogeneous selection (HS), respectively. The boxplot shows the environmental heterogeneity in each bloom stage. The bar plot shows the abundance of 2 harmful algal species. The prebloom stage, without bloom disturbance, may have ecological selection similar to that of the AB stage.
