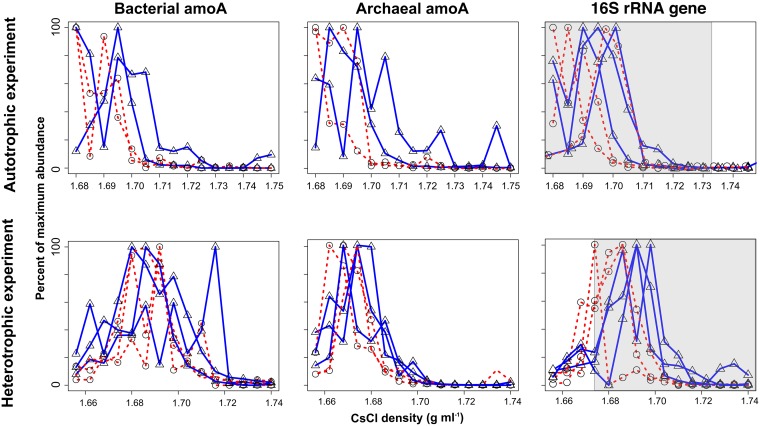
FIG 2.
Quantification of archaeal and bacterial amoA genes and total 16S rRNA genes (using “universal” 16S rRNA primers) across CsCl density gradient fractions after the 1-week incubations. Solid blue lines with triangles represent 13C-labeled substrates, and dashed red lines with circles represent unlabeled substrates. The relative abundance of either 16S rRNA genes or amoA genes normalized to maximal abundance across all density fractions is shown along the y axis. Shaded areas represent the fractions sequenced for qSIP analysis.

