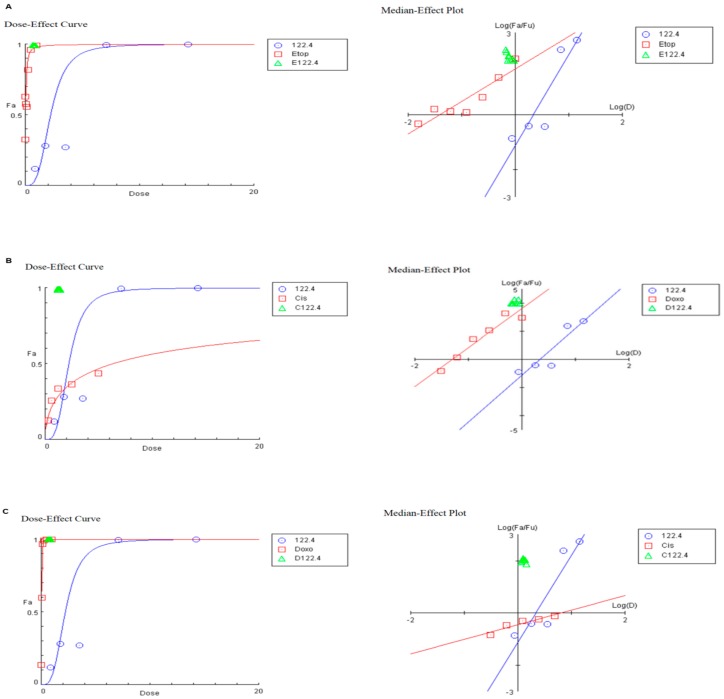
Figure 2.
Dose-Effect Curve and its linearization with the Median-Effect Plot for a single and combination treatment of 122.4 and chemotherapy drugs. Right side represents the median-effect plot of single/combination treatment and the left side shows the dose-effect curve of 122.4 with etoposide (Etho), cisplatin (Cis), doxorubicin (Doxo), A–C, respectively. The red line represent chemotherapeutic single treatment, blue line represent the single treatment of 122.4 and green triangle is the combination treatment using ComboSyn (E122.4, C122.4, D122.4 are combinations of 122.4 with etoposide, cisplatin and doxorubicin, respectively).

