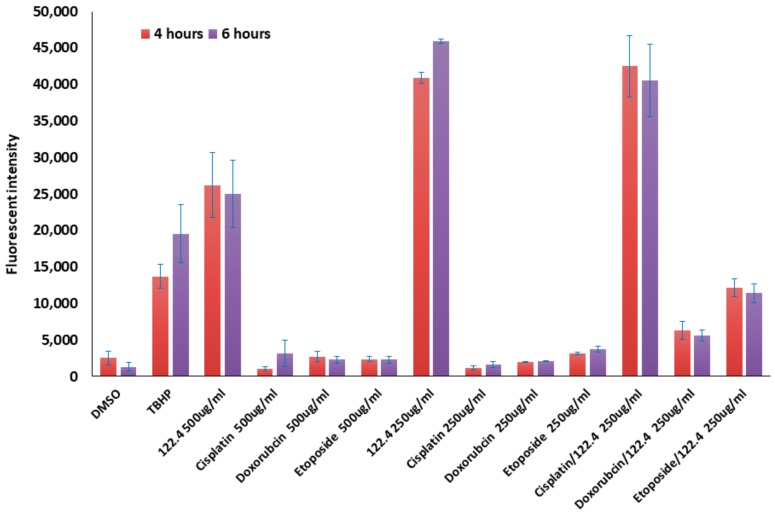
Figure 5.
The effect of 122.4 on ROS production in BS-24-1 in combined treatments. 5 × 10⁵ cells/well were treated with 250–500 μg/mL in a single treatment assay and with 250 μg/mL of both 122.4 and chemotherapeutic drugs in the combined treatment assay. X-axis represents the different treatments. Y-axis represents fluorescence intensity (ROS levels).

