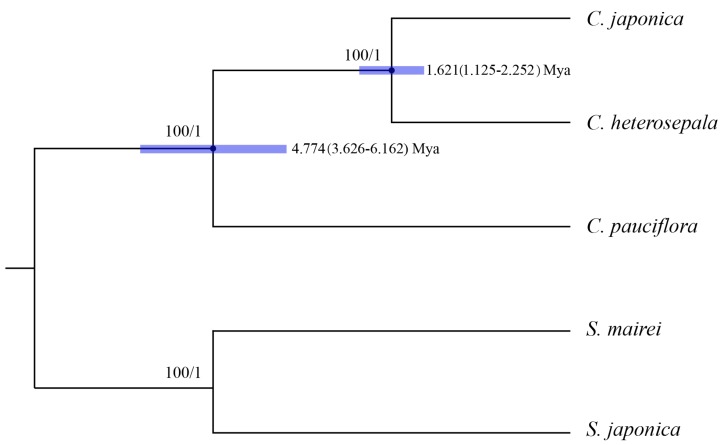
Figure 7.
Phylogenetic relationships of three Croomia species inferred from Maximum Likelihood (ML) and Bayesian Inference (BI) and divergence time of three Croomia species estimated using Bayesian Evolutionary Analysis Sampling Trees (BEAST) analysis. Numbers above the lines represent ML bootstrap values and BI posterior probability. Blue bars indicate the 95% highest posterior density (HPD) credibility intervals for node ages (Mya). Numbers at the node represent divergence time (Mya) and 95% highest posterior density intervals. The phylogenetic tree based on 74 protein-coding genes is completely consistent with this topology.

