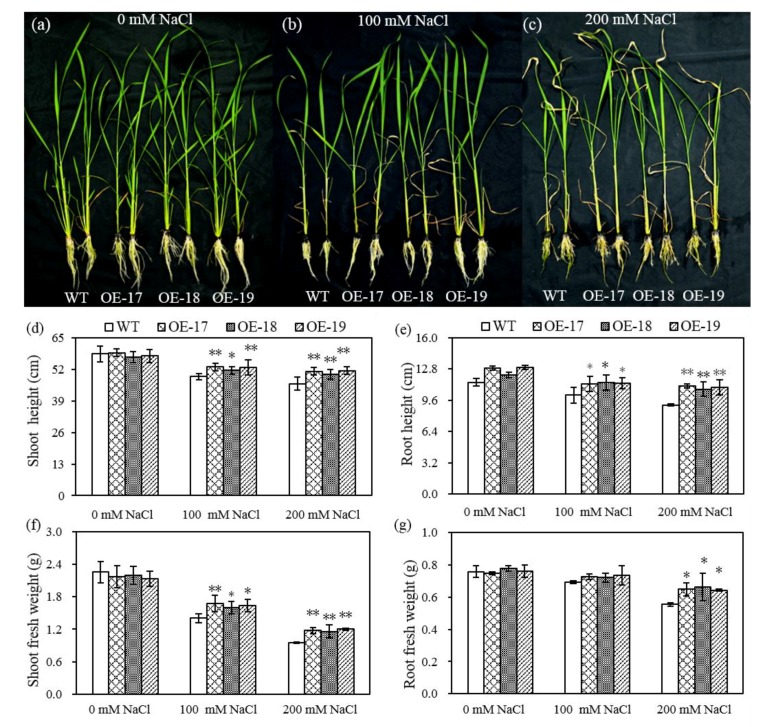
Figure 3.
The differences in phenotypes and in the biomass of rice in response to NaCl stress. The rice phenotypes were placed in hydroponics with solutions of 0 mM NaCl, (a) 100 mM NaCl, (b) and 200 mM NaCl (c). (d) Shoot height. (e) Root height. (f) Shoot fresh weight. (g) Root fresh weight. The others are the same as in Figure 2. * and ** indicate significant differences at the p < 0.05 level and p < 0.01 level, respectively (LSD-test).

