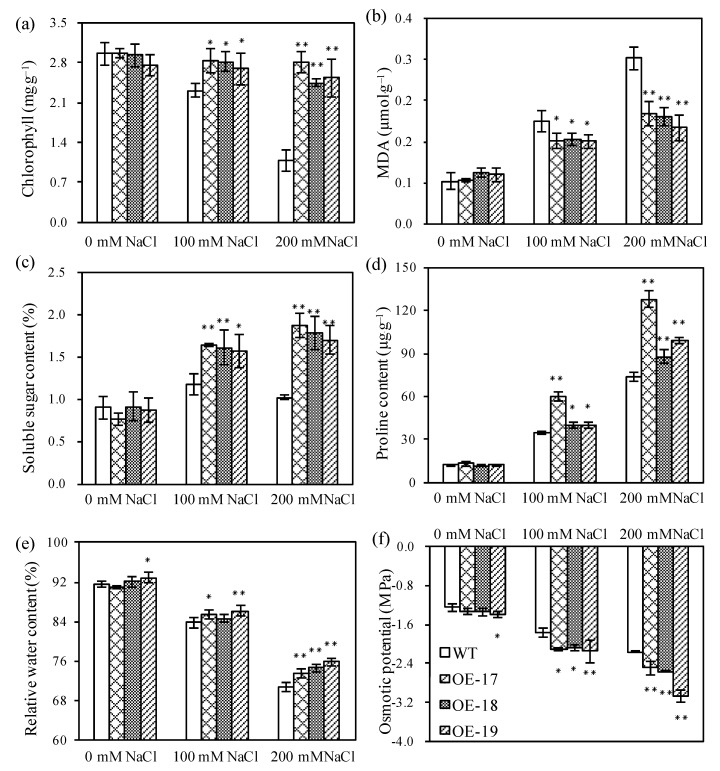
Figure 5.
The accumulation profiles of physiological metabolites in rice lines in response to salt stress. (a) Chlorophyll content. (b) Malondialdehyde (MDA) content. (c) Soluble sugar content. (d) Proline content. (e) Relative water contents. (f) Osmotic potential of leaves. * and ** indicate significant differences at the p < 0.05 level and at the p < 0.01 level, respectively (LSD-test).

