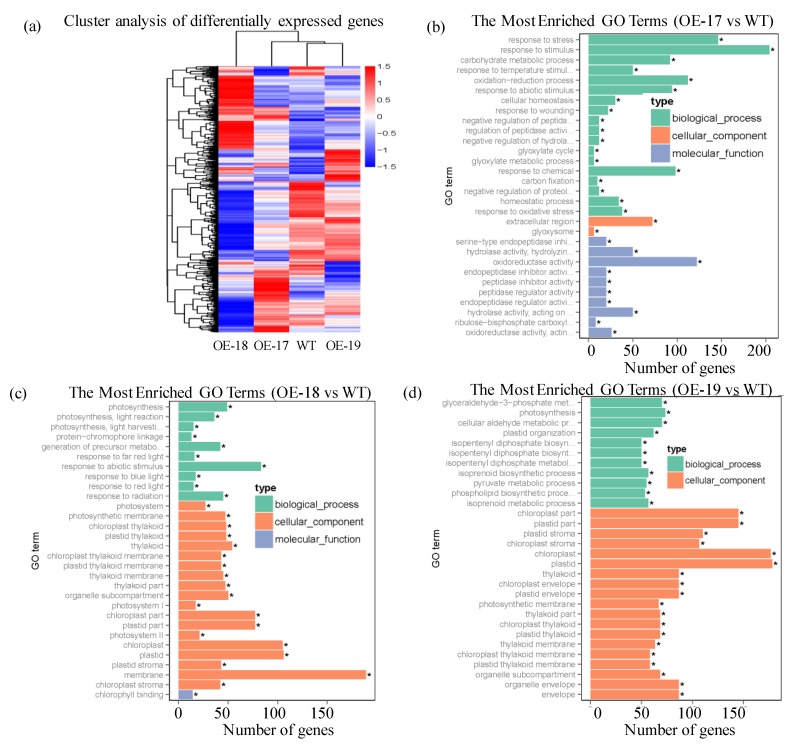
Figure 9.
The distribution profiles of up- or down-regulated differentially expressed genes. (a) Cluster analysis of differentially expressed genes. (b) The most enriched GO terms of the up-regulated genes in the transgenic OE-17; (c) The most enriched GO terms of the up-regulated genes in the transgenic OE-18; (d) The most enriched GO terms of the up-regulated genes in the transgenic OE-19. * indicates significant differences at the p < 0.05 level.

