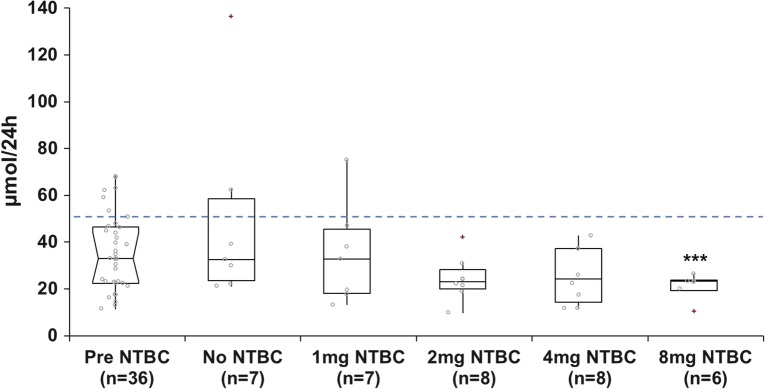
Fig. 3.
Urinary 5-hydroxyindole acetic acid concentrations in patients with alkaptonuria before treatment with nitisinone and after no treatment (n = 7); treatment with 1 mg nitisinone daily (n = 7); treatment with 2 mg nitisinone daily (n = 8); treatment with 4 mg nitisinone daily (n = 8) and treatment with 8 mg nitisinone daily (n = 6). Dashed line = indicates upper limit of normal urine reference range for 5-hydroxyindole acetic acid, <50 μmol/24 h; − = 95% confidence notched outlier boxplot; + = outlier; circle = individual patient concentrations. Significance testing compared 5-hydroxyindole acetic acid concentrations before and after a 4-week trial of nitisinone. *** = p < 0.05

