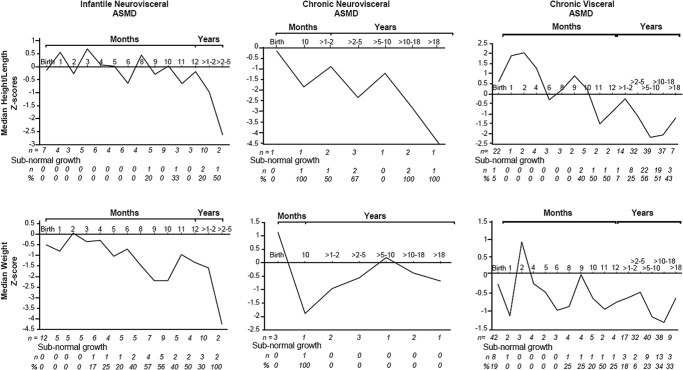
Fig. 1.
Z-scores for height/length and weight over time. Z-scores are plotted for the indicated time points across all three ASMD phenotypes. Number of patients (n) and number and percent with subnormal growth (defined as <5th percentile of the reference population based on NCHS/WHO international reference data for weight and height of children) at each time point are indicated below the graphs

