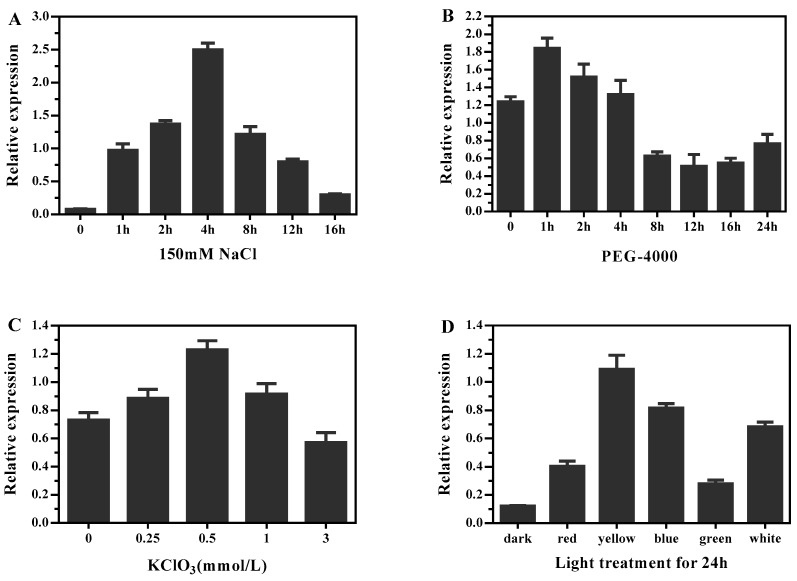
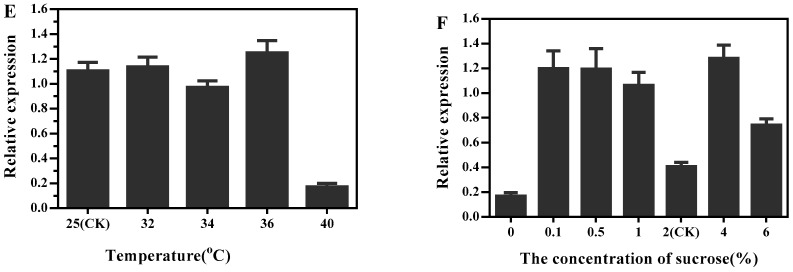
Figure 10.
DlMFT expression in response to abiotic stress. EC was treated with nutrient solution containing 150 mM NaCl or PEG-4000 for different times, KClO3 at the indicated concentrations, or exposed to different light qualities. RNA was isolated from samples treated with: (A) 150 mM NaCl (0, 1, 2, 4, 8, 12 and 16 h), (B) PEG-4000 (0, 1, 2, 4, 8, 12, 16 and 24 h), (C) different light qualities (dark, red, green, blue, and white) for 24 h, (D) KClO3 (0.25, 0.5, 1 and 3 mM/L), (E) different temperature (25, 32, 34, 36 and 40 °C), (F) sucrose (0, 0.1, 0.5, 1.0, 2.0, 4.0 and 6.0%). Reference genes were EF1a, FSD, and elf4a. Data are means ± SD (n = 3).


