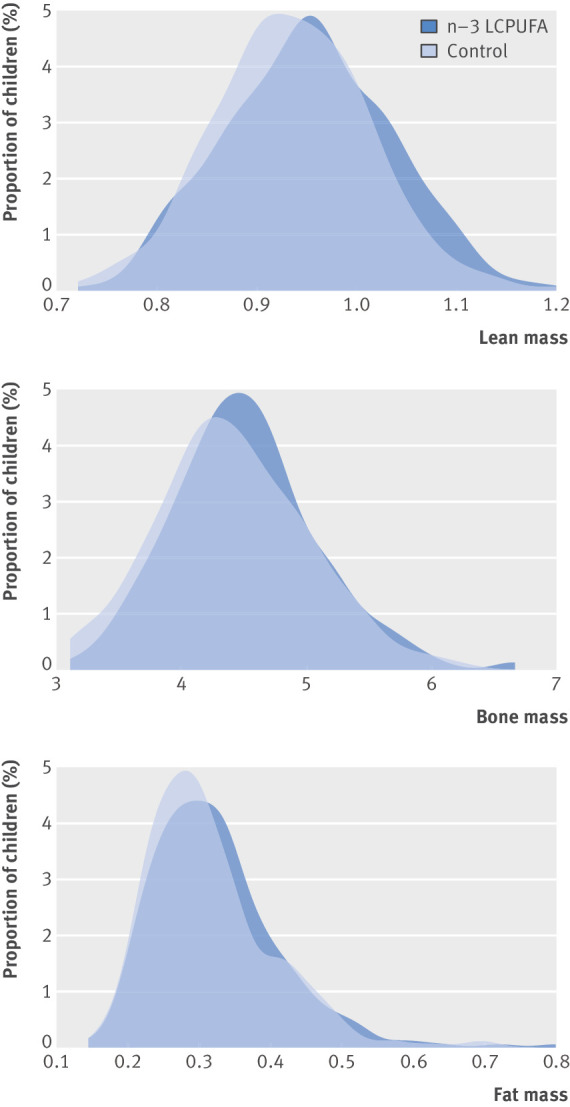
Fig 2.

Density plot showing lean mass, bone mass, and fat mass stratified by supplementation groups: n-3 long chain polyunsaturated fatty acid (n-3 LCPUFA) and control. Lean mass and fat mass are adjusted for (height+height^2); g/cm+cm^2. Bone mass is adjusted for height; g/cm.
