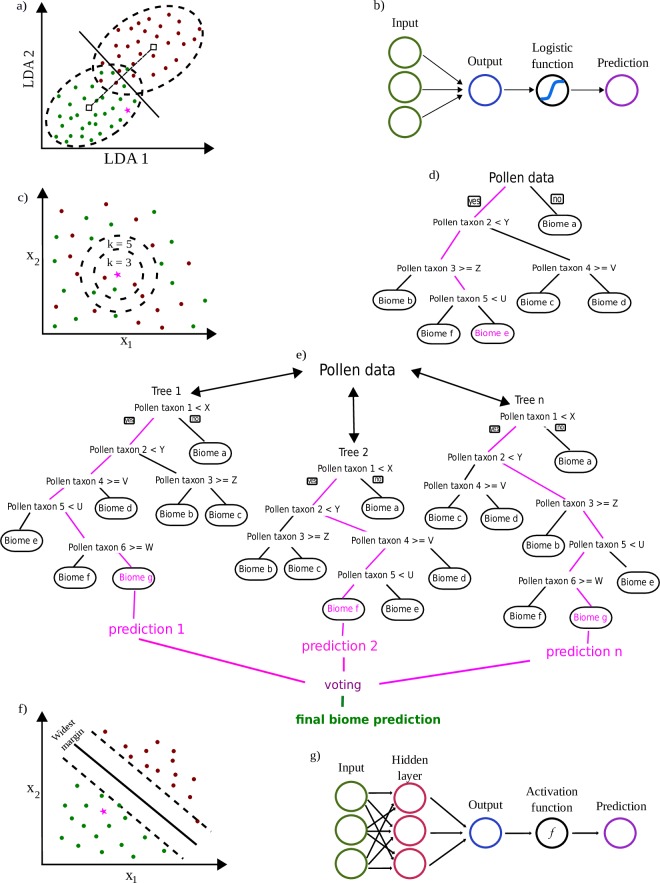
Fig 1. Simplified representation of the classification process for the statistical and machine learning algorithms used for predicting biome.
a) Linear Discriminant Analysis, b) Logistic Regression, c) K-Nearest Neighbors, d) Classification Decision Tree, e) Random Forest, f) Support Vector Machines, and g) Neural Networks. Naïve Bayes classifier not depicted. Red and green dots in panels a), c), and f) represents two classes of data while pink stars represent a new pollen assemblage without biome label. Pink lines in d), and e) represent decision paths.

